Earth Observation-powered decision-making for aquaculture in Southern Africa and West Indian Ocean
The MarCOSIO Consortium, part of Phase II of the GMES & Africa programme, leverages satellite data to provide decision support tools for marine and coastal management. One key service focuses on detecting and monitoring algal blooms, enabling aquaculturalists to make informed decisions about the running of their operations.
From communications to weather monitoring to stunning images, satellites have become essential technologies. Now more than ever, it is becoming clear that harnessing satellite-based earth observation data can help us solve some of the biggest challenges of our time.
Co-financed by the European Commission and the African Union Commission, the Global Monitoring for Environment and Security and Africa (GMES & Africa) programme seeks to harness earth observation data from the Copernicus Earth Observation programme to support and build capacity for sustainable development.
Phase II of the programme, which launched in 2022, supports eight consortia, two of which are dedicated to the marine & coastal services thematic area, including the Marine and Coastal Operations for Southern Africa and the Indian Ocean (MarCOSIO) Consortium.

Supporting ocean and coastal decisions
As the name suggests, MarCOSIO focuses on marine and coastal aspects of sustainable development in several African partner countries such as Kenya, Namibia, and South Africa. At MarCOSIO, “we combine observation technologies and practices and put them in decision support tools, applications and mobile apps to support decision makers on oceans and coastal information,” says Riëtte Pretorius, project manager of the MarCOSIO Consortium and principal project manager at the Council for Scientific and Industrial Research (CSIR), South Africa.
Alongside activities such as training and network/collaboration-building events, MarCOSIO offers three groups of services. Falling under their marine and maritime services are the ship traffic monitoring and safety at sea initiatives. The coastal monitoring service focuses on water quality and coral bleaching monitoring. Finally, the fisheries and aquaculture services look to support fishers and aquaculturists, respectively. The aquaculture algal bloom monitoring service is MarCOSIO’s longest-running service.

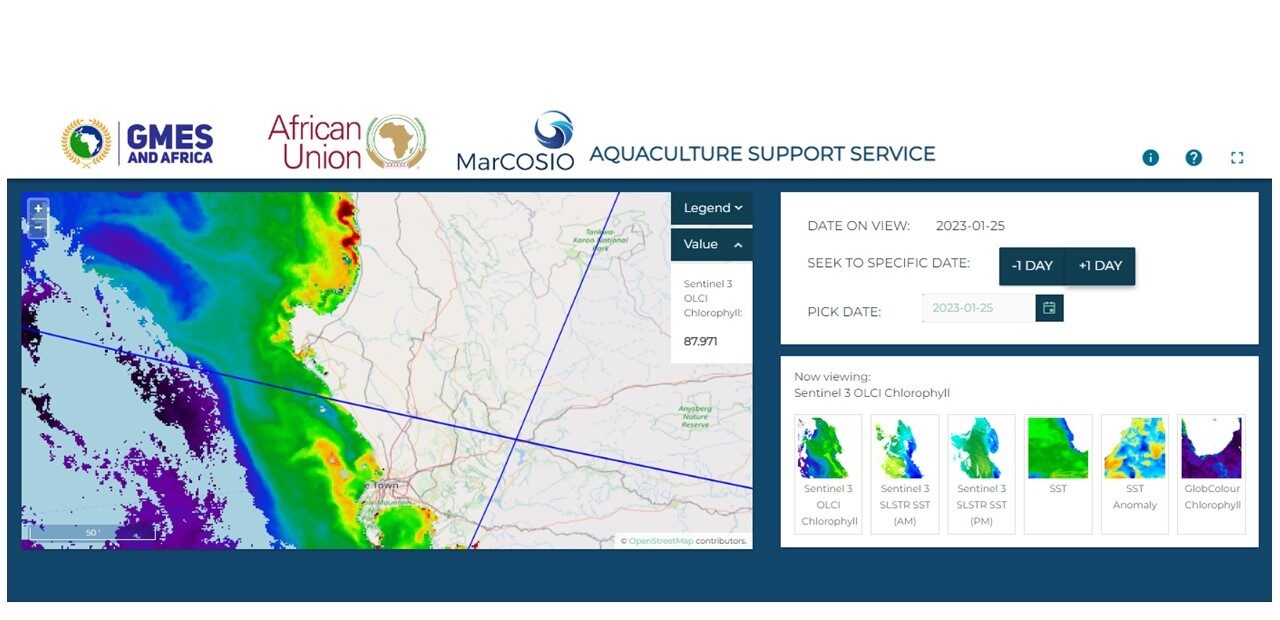
A screenshot of the MarCOSIO Aquaculture service, showing a map of the regional chlorophyll a concentration product, derived from Sentinel 3, on 25 January, 2023 for the coastal waters of the Western Cape, South Africa. The red region near the coast indicates the persistence of a high biomass phytoplankton bloom, which lead to a crayfish walkout event during February 2023.
A blooming nuisance
Algal blooms occur when phytoplankton, tiny algae that float freely in the water, proliferate in response to excess nutrients, such as nitrogen or phosphorous, and other favourable conditions, such as calm waters. “We can get really high biomass blooms, usually caused by various dinoflagellate species, especially along the west coast and the south coast of South Africa, and further up towards Namibia,” says Dr Marié Smith, senior researcher in the Coastal Systems and Earth Observation research group at CSIR. Sitting on the sea surface, large blooms can block sunlight to plants and animals below, increase water acidity, and decrease oxygen levels during decay. Some algal blooms, such as those caused by the blue-green algae cyanobacteria, also produce toxins harmful to marine life and any unsuspecting person who eats a contaminated animal.
Aquaculture is a growing part of many African nations’ blue economy. The ability to detect and monitor algal blooms can help aquaculturalists plan for and mitigate against algal blooms. For example, aquaculturalists may alter their harvesting schedules or the timing for putting a new batch of juveniles into the water.
Powered by Copernicus data
The aquaculture support service provides two key pieces of information – chlorophyll concentration, an indicator of phytoplankton, and sea surface temperature, an indicator of upwelling or stratification. The underlying data comes in the form of Sentinel 3 satellite data from the EUMETSAT and two ocean models (the Operational Sea Surface Temperature and Ice Analysis (OSTIA) and the GlobColour Chlorophyll) from the Copernicus Marine Service. The Sentinel 3 data is high resolution, but since cloud cover can obscure the Satellite’s view of the ocean from space, there may be gaps in the coverage. The models are lower resolution but use multiple data sources and algorithms to create gap-free maps.
In the summer months, when blooms are more likely, aquaculturalists will “look at the chlorophyll concentration and sea surface temperature [maps] and decide whether there’s likely to be any impact from a bloom on the day or not,” explains Smith.
Although this service was created for aquaculture, other people find the information useful too. “I know of people using it to decide which beach they’re going to go swimming at based on sea surface temperatures,” says Smith. Perhaps more closely related to aquaculture, the underlying data is also used for the MarCOSIO-ABALOBI partnership product for small-scale fishers. Here, the sea surface temperature information reveals areas with temperature gradients that tend to attract groups of fish.
“It’s people on the ground that are looking at and using the information,” says Smith. “These [services] are free and open. Anybody can access them.”
Useful links
- MarCOSIO – Marine and Coastal Operations for Southern Africa and the Indian ocean
- The Africa Blue Economy Strategy (African Union)
- EU4OceanObs overview of the GMES and Africa programme: https://www.eu4oceanobs.eu/gmes-and-africa
- GMES and Africa programme management unit blogspot for latest news and events: https://gmes4africa.blogspot.com/
- Daily Maverick news report on the crayfish (rock lobster) walkout along the Western Cape, South Africa, in February 2023: https://www.dailymaverick.co.za/article/2023-02-10-mass-lobster-walkout-the-latest-in-increasing-red-tide-incidence/


